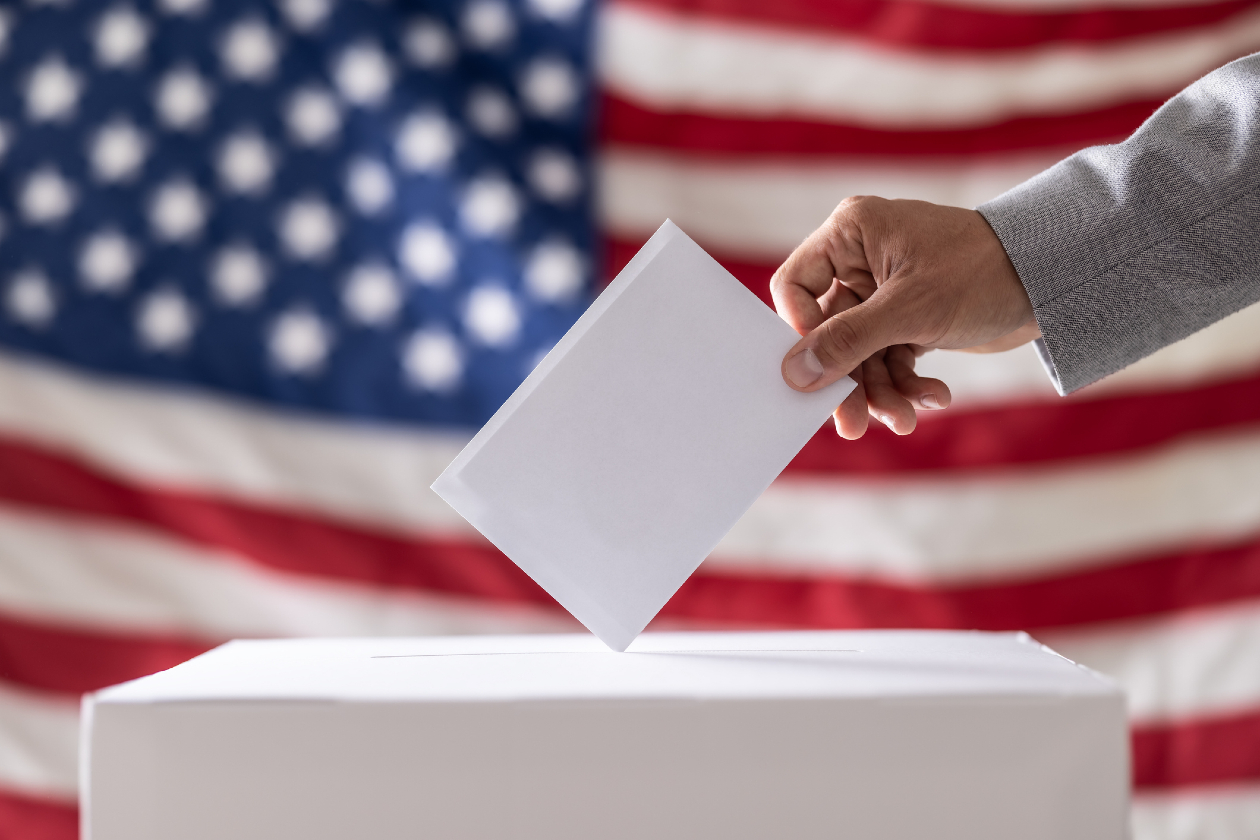
Control of the House of Representatives hinges on a razor-thin margin. Republicans currently hold a narrow 218-214 edge, meaning Democrats require a net gain of only three seats to seize the majority and gain the power to scrutinize the administration. The Senate map is equally precarious, with 35 seats up for grabs. Democrats must flip four seats to reach a 51-vote majority, as any 50-50 tie would be broken by Vice President JD Vance.
Beyond federal power, the landscape includes 36 gubernatorial races and over 6,000 state legislative contests. Financial engagement has reached unprecedented levels; tracking firms like AdImpact and Kinetiq estimate total ad spending will hit $12 billion, shattering the previous 2022 midterm record of $8.9 billion. This surge is highlighted by the California governor's primary, which alone absorbed $330 million in advertising.
Public sentiment remains a significant variable for the GOP. Recent polling data from PBS News, NPR, and Marist shows a 53-41 percent advantage for Democratic congressional candidates among registered voters. Simultaneously, presidential approval ratings have struggled, with various September surveys placing the president between 31 and 41 percent. With 55 percent of voters telling NBC News that his policies have hindered the economy, the political environment suggests a challenging path for his party's candidates as they navigate 474 nationwide electoral rematches.



Comments (0)
No comments yet. Be the first!